LA Crime Insights
Exploring data driven approaches to study crime in LA
Facts

In 2023, the city of Los Angeles had a total population
of 3,769,485.
World Population Review

Between 2010 and 2016, crime in Los Angeles county rose by 5%, while crime across the entire state of California declined by about 5%.
Berger, 2018

Los Angeles Times noted that violent crime increased by 27%, most notably in the city of Los Angeles where assaults went up by 60%.
Los Angeles Times, 2017
*Raqota Berger is a professor of Criminology and Justice Studies at California State University

Motivation:
- In the summer of 2023, a stabbing rampage occurred in Seoul, South Korea. There were at least 14 people who were injured due to the back-to-back rampage. There were dozens of threats to commit copycat crimes targeting populated areas in South Korea at specified times and dates on online and social media platforms.
- Due to this event, a group of South Korean college students developed an app by the name of “Terrorless” which indicated the location of the possible threats on the digital map for the public’s safety.
- The United States has been going through a war against high crime rates. Even with a decrease in crime rates, residents of Los Angeles, one of the most populated urban areas in the U.S., continue to experience pervasive fear. To alleviate the fear, it is important to understand the dynamics of crime in Los Angeles.
- Hence, I decided to focus on one of the most well-known and populated cities, Los Angeles.

Purpose of the Study
Identify Crime trends & patterns
I am using statistical methods and data visualizations to answer three main questions: “Who is affected?”, “When and where are impacted?”, and “What are the ways in which users can interact with the data?” Through this study, I aim to identify crime trends and patterns within Los Angeles to highlight the importance of crime analysis and educate Los Angeles residents.
Overview on reported crimes in LA
during the year of 2022
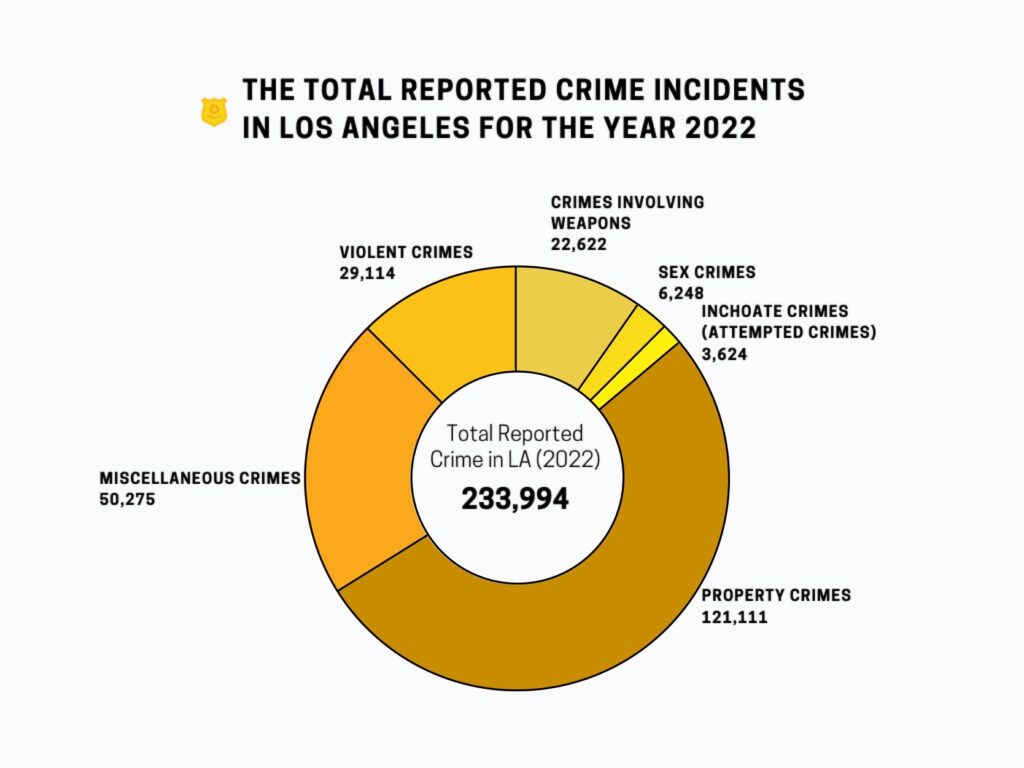
Types of Crime By Percentage
- Property Crimes
- 52.2%
- Miscellaneous Crimes
- 21.5%
- Violent Crimes
- 12.4%
- Crimes Involving Weapons
- 9.7%
- Sex Crimes
- 2.7%
- Inchoate Crimes (Attempted Crimes)
- 1.5%

*This pie chart depicts solely the crimes reported to LAPD in 2022.

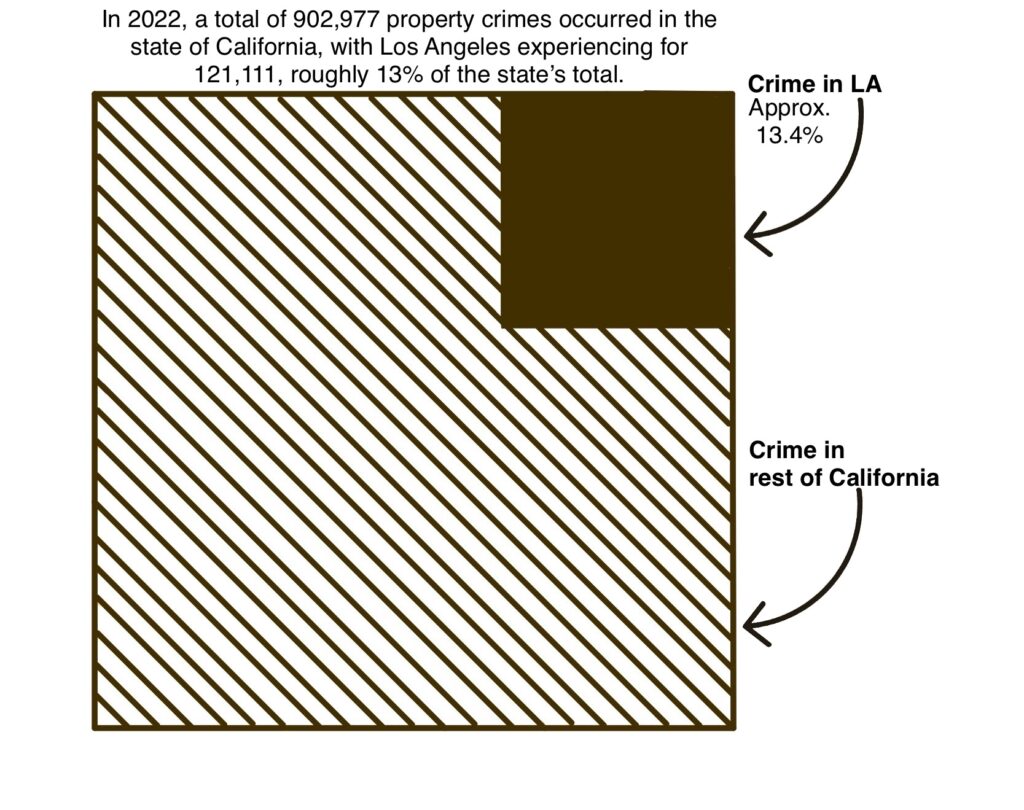
*The data regarding total property crimes in California is sourced from California Attorney General Rob Bonta.
Property Crimes in LA and State of California
- Property crimes are one of the most common offenses in both the state of California and Los Angeles.
- Crimes in LA account for a high percentage (approximately 13.4%) of the total crimes occurring in the state of California.
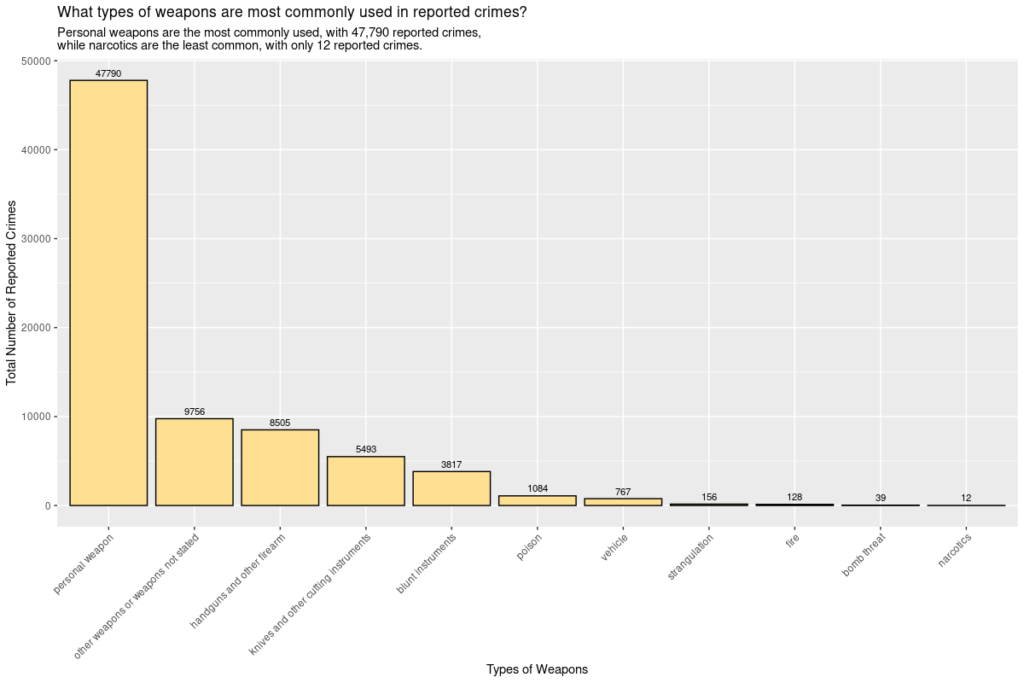
Top 5 most commonly used weapons
- Personal weapons
- 61.6%
- Other weapons or weapons not stated
- 12.6%
- Handguns and other firearms
- 11%
- Knives and other cutting instruments
- 7.1%
- Blunt instruments
- 4.9%

*This bar chart depicts solely the crimes reported to LAPD in 2022 and accounts for 97.1% of the overall crimes in LA.
About me…
My name is Keeyeon Choi and I am currently pursuing a Statistical & Data Sciences major with a minor in Economics at the College of Wooster in Wooster, Ohio. As part of my Senior Independent Study, I chose to create this website because I believe it would be the best way to inform and engage people about crimes in LA. I focus on investigating crimes that occurred in Los Angeles as it is one of the most populated areas in the United States with a history of high rates of crimes.
Thank you for visiting, and I look forward to sharing insights about crime in LA with you.